Superstar Hide and Seek
by Dr. Tony Phillips
It sounds like an impossible task: Take a star a hundred times larger in diameter and millions of times more luminous than the Sun and hide it in our own galaxy where the most powerful optical telescopes on Earth cannot find it.
But it is not impossible. In fact, there could be dozens to hundreds of such stars hiding in the Milky Way right now. Furiously burning their inner stores of hydrogen, these hidden superstars are like ticking bombs poised to go supernova at any moment, possibly unleashing powerful gamma-ray bursts. No wonder astronomers are hunting for them.
Earlier this year, they found one.
"Its called the Peony nebula star," says Lidia Oskinova of Potsdam University in Germany. "It shines like 3.2 million suns and weighs in at about 90 solar masses."
The star lies behind a dense veil of dust near the center of the Milky Way galaxy. Starlight traveling through the dust is attenuated so much that the Peony star, at first glance, looks rather dim and ordinary. Oskinovas team set the record straight using NASAs Spitzer Space Telescope. Clouds of dust can hide a star from visible-light telescopes, but Spitzer is an infrared telescope able to penetrate the dusty gloom.
"Using data from Spitzer, along with infrared observations from the ESOs New Technology Telescope in Chile, we calculated the Peony stars true luminosity," she explains. "In the Milky Way galaxy, it is second only to another known superstar, Eta Carina, which shines like 4.7 million suns."
Oskinova believes this is just the tip of the iceberg. Theoretical models of star formation suggest that one Peony-type star is born in our galaxy every 10,000 years. Given that the lifetime of such a star is about one million years, there should be 100 of them in the Milky Way at any given moment.
Could that be a hundred deadly gamma-ray bursts waiting to happen? Oskinova is not worried.
"Theres no threat to Earth," she believes. "Gamma-ray bursts produce tightly focused jets of radiation and we would be extremely unlucky to be in the way of one. Furthermore, there dont appear to be any supermassive stars within a thousand light years of our planet."
Nevertheless, the hunt continues. Mapping and studying supermassive stars will help researchers understand the inner workings of extreme star formation and, moreover, identify stars on the brink of supernova. One day, astronomers monitoring a Peony-type star could witness with their own eyes one of the biggest explosions since the Big Bang itself.
Now that might be hard to hide.
Find out the latest news on discoveries using the Spitzer at http://www.spitzer.caltech.edu
Kids (of all ages) can read about "Lucys Planet Hunt" using the Spitzer Space Telescope at http://spaceplace.nasa.gov/en/kids/spitzer/lucy
This article was provided by the Jet Propulsion Laboratory, California Institute of Technology, under a contract with the National Aeronautics and Space Administration.
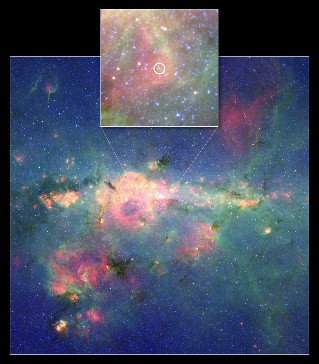
Caption: The "Peony Nebula" star is the second-brightest found in the Milky Way Galaxy, after Eta Carina. The Peony star blazes with the light of 3.2 million suns.
What Happened to Comet Holmes?
by Dr. Tony Phillips
One year after Comet 17P/Holmes shocked onlookers by exploding in the night sky, researchers are beginning to understand what happened.
"We believe that a cavern full of ice, located as much as 100 meters beneath the crust of the comets nucleus, underwent a change of phase," says Bill Reach of NASA's Spitzer Science Center at the California Institute of Technology. "Amorphous ice turned into crystalline ice" and, in the transition, released enough heat to cause Holmes to blow its top.
Anyone watching the sky in October 2007 will remember how the comet brightened a million-fold to naked-eye visibility. It looked more like a planet than a comet - strangely spherical and utterly lacking a tail. By November 2007, the expanding dust cloud was larger than Jupiter itself, and people were noticing it from brightly-lit cities.
Knowing that infrared telescopes are particularly sensitive to the warm glow of comet dust, Reach and colleague Jeremie Vaubaillon, also of Caltech, applied for observing time on the Spitzer Space Telescope - and they got it. "We used Spitzer to observe Comet Holmes in November and again in February and March 2008," says Reach.
The infrared glow of the expanding dust cloud told the investigators how much mass was involved and how fast the material was moving. "The energy of the blast was about 10 to the 14th power joules and the total mass was of order 10 to the 10th power kg." In other words, Holmes exploded like 24 kilotons of TNT and ejected 10 million metric tons of dust and gas into space.
These astonishing numbers are best explained by a subterranean cavern of phase-changing ice, Reach believes. "The mass and energy are in the right ballpark," he says, and it also explains why Comet Holmes is a "repeat exploder."
Another explosion was observed in 1892. It was a lesser blast than the 2007 event, but enough to attract the attention of American astronomer Edwin Holmes, who discovered the comet when it suddenly brightened. Two explosions (1892, 2007) would require two caverns. Thats no problem because comets are notoriously porous and lumpy. In fact, there are probably more than two caverns, which would mean Comet Holmes is poised to explode again.
When?
"The astronomer who can answer that question will be famous!" laughs Vaubaillon.
"No one knows what triggered the phase change," says Reach. He speculates that maybe a comet-quake sent seismic waves echoing through the comets caverns, compressing the ice and changing its form. Or a meteoroid might have penetrated the comets crust and set events in motion that way. "Its still a mystery."
But not as much as it used to be.
See more Spitzer images of comets and other heavenly objects at www.spitzer.caltech.edu. Kids and grownups can challenge their spatial reasoning powers by solving Spitzer infrared "Slyder" puzzles at http://spaceplace.nasa.gov/en/kids/spitzer/slyder
This article was provided by the Jet Propulsion Laboratory, California Institute of Technology, under a contract with the National Aeronautics and Space Administration.
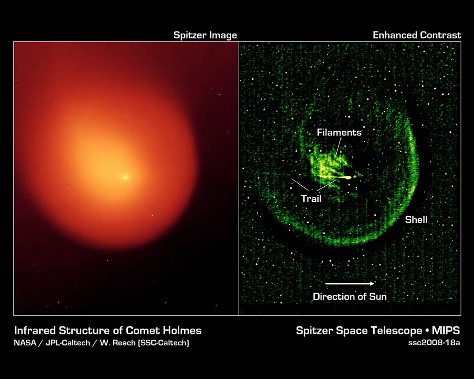
Caption: Comet Holmes as imaged by the multiband imaging photometer (MIPS) on the Spitzer Space Telescope. The enhanced contrast image at the right shows the comets outer shell and mysterious filaments of dust.
The Chemical Weather Report
"Sunny tomorrow with highs in the mid-70s. Theres going to be some carbon monoxide blowing in from forest fires, and all that sunshine is predicted to bring a surge in ground-level ozone by afternoon. Old and young people and anyone with lung conditions are advised to stay indoors between 3 and 5 p.m."
Whoever heard of a weather report like that?
Get used to it. Weather reports of the future are going to tell you a lot more about the atmosphere than just how warm and rainy it is. In the same way that satellite observations of Earth revolutionized basic weather forecasting in the 1970s and 80s, satellite tracking of air pollution is about to revolutionize the forecasting of air quality. Such forecasts could help people plan around high levels of ground-level ozone - a dangerous lung irritant - just as they now plan around bad storms.
"The phrase that people have used is chemical weather forecasting," says Kevin Bowman of NASAs Jet Propulsion Laboratory. Bowman is a senior member of the technical staff for the Tropospheric Emission Spectrometer, one of four scientific sensors on NASAs Aura satellite.
Aura and other NASA satellites track pollution in the same way that astronomers know the chemical composition of stars and distant planetary atmospheres: using spectrometry. By breaking the light from a planet or star into its spectrum of colors, scientists can read off the atmospheres gases by looking at the "fingerprint" of wavelengths absorbed or emitted by those chemicals. From Earth orbit, pollution-watching satellites use this trick to measure trace gases such as carbon monoxide, nitrogen oxide, and ozone.
However, as Bowman explains, "Polar sun-synchronous satellites such as Aura are limited at best to two overpasses per day." A recent report by the National Research Council recommends putting a pollution-watching satellite into geosynchronous orbit - a special very high-altitude orbit above the equator in which satellites make only one orbit per day, thus seeming to hover over the same spot on the equator below. There, this new satellite, called GEOCAPE (Geostationary Coastal and Air Pollution Events), would give scientists a continuous eye in the sky, allowing them to predict daily pollution levels just as meteorologists predict storms.
"NASA is beginning to investigate what it would take to build an instrument like this," Bowman says. Such a chemical weather satellite could be in orbit as soon as 2013, according to the NRC report. Weather forecasts might never be the same.
Learn more about the Tropospheric Emission Spectrometer at http://tes.jpl.nasa.gov
Kids can learn some elementary smog chemistry while making "Gummy Greenhouse Gases" out of gumdrops at http://spaceplace.nasa.gov/en/kids/tes/gumdrops
This article was provided by the Jet Propulsion Laboratory, California Institute of Technology, under a contract with the National Aeronautics and Space Administration.
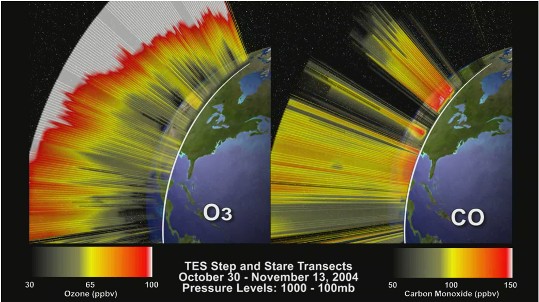
Caption: Example of visualization of data from the Tropospheric Emission Spectrometer. These frames are from an animation that steps through transects of the atmosphere profiling vertical ozone and carbon monoxide concentrations, combining all tracks of the Aura satellite during a given two week period.
Extreme Starburst
by Dr. Tony Phillips
A star is born. A star is born. A star is born.
Repeat that phrase 4000 times and you start to get an idea what life is like in distant galaxy J100054+023436.
Astronomers using NASA's Spitzer Space Telescope and ground-based observatories have found that the galaxy gives birth to as many as 4000 stars a year. For comparison, in the same period of time the Milky Way produces only about 10. This makes J100054+023436 an extreme starburst galaxy.
"We call it the Baby Boom galaxy'," says Peter Capak of NASAs Spitzer Science Center at the California Institute of Technology in Pasadena, CA. "It is undergoing a major baby boom, producing most of its stars all at once. If our human population was produced in a similar boom, then almost all people alive today would be the same age."
Capak is lead author of a paper entitled "Spectroscopic Confirmation of an Extreme Starburst at Redshift 4.547" detailing the discovery in the July 10th issue of Astrophysical Journal Letters.
The galaxy appears to be a merger, a "train wreck" of two or more galaxies crashing together. The crash is what produces the baby boom. Clouds of interstellar gas within the two galaxies press against one another and collapse to form stars, dozens to hundreds at a time.
This isnt the first time astronomers have witnessed a galaxy producing so many stars. "There are some other extreme starburst galaxies in the local universe," says Capek. But the Baby Boom galaxy is special because it is not local. It lies about 12.3 billion light years from Earth, which means we are seeing it as it was 12.3 billion years ago. The universe itself is no older than 14 billion years, so this galaxy is just a youngster (Capak likens it to a 6-year-old human) previously thought to be incapable of such rapid-fire star production.
The Baby Boom galaxy poses a challenge to the Hierarchical Model of galaxy evolution favored by many astronomers. According to the Hierarchical Model, galaxies grow by merging; Add two small galaxies together, and you get a bigger galaxy. In the early years of the universe, all galaxies were small, and they produced correspondingly small bursts of star formation when they merged. "Yet in J100054+023436, we see an extreme starburst. The merging galaxies must be pretty large."
Capak and colleagues are busy looking for more Baby Boomers "to see if this is a one-off case or a common occurrence." The theory of evolution of galaxies hangs in the balance.
Meanwhile.... A star is born. A star is born. A star is born.
See more breathtaking Spitzer images at http://www.spitzer.caltech.edu/Media/mediaimages
Kids can play the new Spitzer "Sign Here!" game at http://spaceplace.nasa.gov/en/kids/spitzer/signs
This article was provided by the Jet Propulsion Laboratory, California Institute of Technology, under a contract with the National Aeronautics and Space Administration.
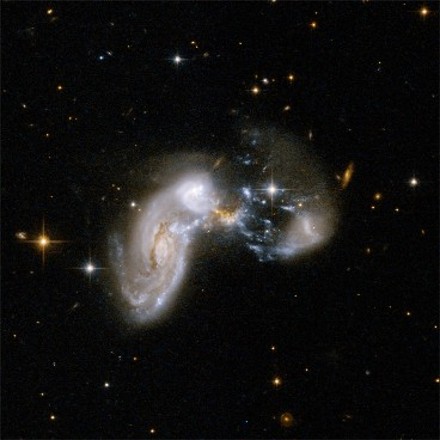
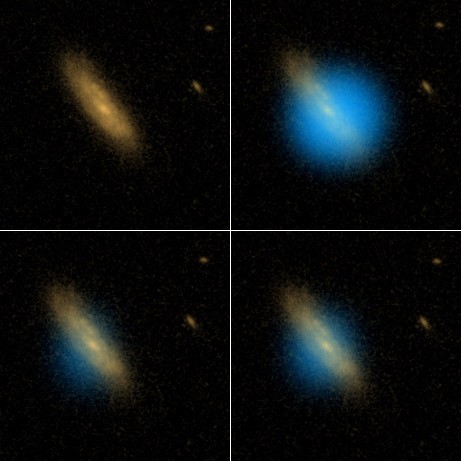
Caption: The "Baby Boom" galaxy loosely resembles the galaxy shown here, called Zw II 96, in this Hubble Space Telescope image. This galaxy is only 500 million light-years away, while the Baby Boom galaxy is 12.3 billion light-years away.
A Google for Satellites: Sensor Web 2.0
If you could see every satellite passing overhead each day, it would look like a chaotic meteor shower in slow motion.
Hundreds of satellites now swarm over the Earth in a spherical shell of high technology. Many of these satellites gaze at the planets surface, gathering torrents of scientific data using a dizzying array of advanced sensors - an extraordinary record of our dynamic planet.
To help people tap into this resource, NASA researchers such as Daniel Mandl are developing a "Google for satellites," a web portal that would make requesting data from Earth-observing satellites almost as easy as typing a search into Google.
"You just click on it and it takes care of all the details for you across many sensors," Mandl explains.
Currently, most satellites are each controlled separately from the others, each one dauntingly complex to use. But starting with NASAs Earth Observing-1 (EO-1) satellite, part of the agencys New Millennium Program, Mandl and his team are building a prototype that stitches these satellites together into a seamless, easy-to-use network called "Sensor Web 2.0."
The vision is to simply enter a location anywhere on Earth into the websites search field along with the desired information types - wildfire maps, vegetation types, floodwater salinity, oil spill extent - and software written by the team goes to work.
"Not only will it find the best sensor, but with proper access rights, you could actually trigger a satellite to take an image in the area of interest," Mandl says. Within hours, the software will send messages to satellites instructing them to gather the needed data, and then download and crunch that raw data to produce easy-to-read maps.
For example, during the recent crisis in Myanmar (Burma) caused by Cyclone Nargis, an experimental gathering of data was triggered through Sensor Web 2.0 using a variety of NASA satellites including EO-1. "One thing we might wish to map is the salinity of flood waters in order to help rescue workers plan their relief efforts," Mandl says. If the floodwater in an area was salty, aid workers would need to bring in bottled water, but if flood water was fresh, water purifiers would suffice. An early and correct decision could save lives.
Thus far, Mandl and his team have expanded Sensor Web 2.0 beyond EO-1 to include three other satellites and an unmanned aircraft. He hopes to double the number of satellites in the network every 18 months, eventually weaving the jumble of satellites circling overhead into a web of sensors with unprecedented power to observe and understand our ever-changing planet.
To learn more about the EO-1 sensor web initiatives, go to http://eo1.gsfc.nasa.gov/new/extended/sensorWeb/sensorWeb.html
Kids (and grown-ups) can get an idea of the resolution of EO-1s Hyperion Imager and how it can distinguish among species of trees - from space at http://spaceplace.nasa.gov/en/kids/eo1_1.shtml
This article was provided by the Jet Propulsion Laboratory, California Institute of Technology, under a contract with the National Aeronautics and Space Administration.
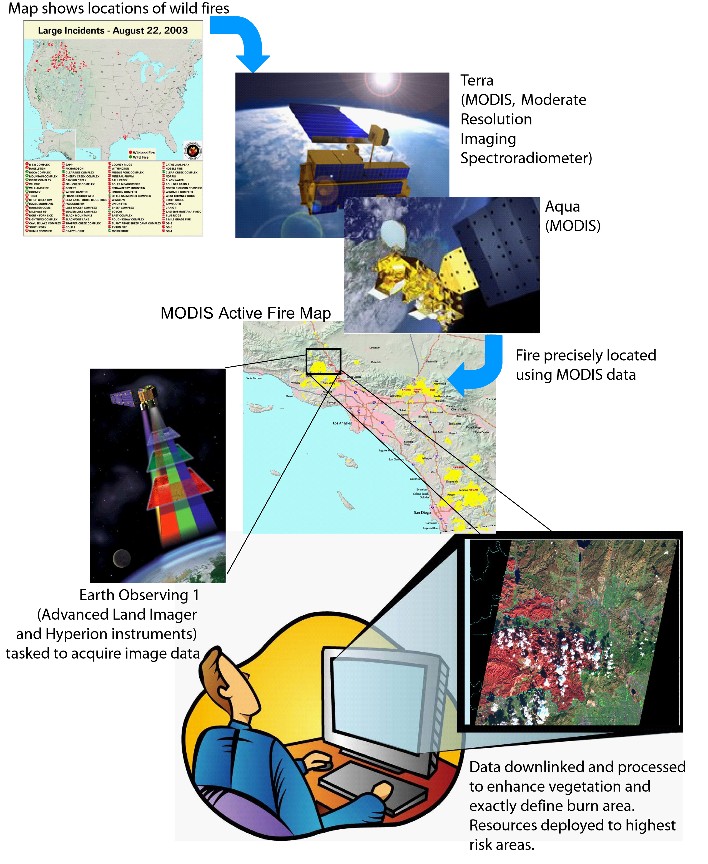
Caption: A "Google for satellites" type of web portal will allow users to request real-time data from Earth observing satellites.
Death of a Supergiant
By all outward appearances, the red supergiant appeared normal. But below the surface, hidden from probing eyes, its core had already collapsed into an ultra-dense neutron star, sending a shock wave racing outward from the stars center at around 50 million kilometers per hour.
The shock wave superheated the plasma in its path to almost a million degrees Kelvin, causing the star to emit high-energy ultraviolet (UV) radiation. About six hours later, the shock wave reached the stars surface, causing it to explode in a Type IIP supernova named SNLS-04D2dc.
Long before the explosions visible light was detected by telescopes on Earth, NASAs Galaxy Evolution Explorer (GALEX) space telescope captured the earlier pulse of UV light - scientists first glimpse of a star entering its death throes.
"This UV light has traveled through the star at the moment of its death but before it was blown apart," explains Kevin Schawinski, the University of Oxford astrophysicist who led the observation. "So this light encodes some information about the state of the star the moment it died."
And thats exactly why astronomers are so excited. Observing the beautiful nebula left behind by a supernova doesnt reveal much about what the star was like before it exploded; most of the evidence has been obliterated. Information encoded in these UV "pre-flashes" could offer scientists an unprecedented window into the innards of stars on the verge of exploding.
In this case, Schawinski and his colleagues calculated that just before its death, the star was 500 to 1000 times larger in diameter than our sun, confirming that the star was in fact a red supergiant. "Weve been able to tell you the size of a star that died in a galaxy several billion light-years away," Schawinski marvels.
"GALEX has played a very important role in actually seeing this for a few reasons," Schawinski says. First, GALEX is a space telescope, so it can see far-UV light thats blocked by Earths atmosphere.
Also, GALEX is designed to take a broad view of the sky. Its relatively small 20-inch primary mirror gives it a wide, 1.2-degree field of view, making it more likely to catch the UV flash preceding a supernova.
With these advantages, GALEX is uniquely equipped to catch a supernova before it explodes. "Just when we like to see it," Schawinski says.
For more information, visit http://www.galex.caltech.edu, then click on "Ultraviolet Gives View Inside Real Death Star."
Kids can check out how to make a mobile of glittering galaxies at http://spaceplace.nasa.gov/en/kids/galex_make1.shtml
This article was provided by the Jet Propulsion Laboratory, California Institute of Technology, under a contract with the National Aeronautics and Space Administration.
Caption: Sequence of images shows supernova start to finish. The top left image shows the galaxy before the supernova. At top right, the bright UV flash called the shock breakout indicates a red supergiant has collapsed. At bottom left, moments later, the flash is mostly gone. As the debris expands, it heats up again and becomes brighter (bottom right). The supernova became 10 times the size of the original over the following few days, thus becoming visible to supernova hunters.
Space Buoys
By Dr. Tony Phillips
Congratulations! Youre an oceanographer and youve just received a big grant to investigate the Pacific Ocean. Your task: Map the mighty Pacifics wind and waves, monitor its deep currents, and keep track of continent-sized temperature oscillations that shape weather around the world. Funds are available and you may start immediately.
Oh, theres just one problem: Youve got to do this work using no more than one ocean buoy.
"That would be impossible," says Dr. Guan Le of the Goddard Space Flight Center. "The Pacifics too big to understand by studying just one location."
Yet, for Le and her space scientist colleagues, this was exactly what they have been magnetosphere is an "ocean" of magnetism and plasma surrounding our planet. Its shores are defined by the outer bounds of Earths magnetic field and it contains a bewildering mix of matter-energy waves, electrical currents and plasma oscillations spread across a volume billions of times greater than the Pacific Ocean itself.
"For many years weve struggled to understand the magnetosphere using mostly single spacecraft," says Le. "To really make progress, we need many spacecraft spread through the magnetosphere, working together to understand the whole."
Enter Space Technology 5.
In March 2006 NASA launched a trio of experimental satellites to see what three "buoys" could accomplish. Because they weighed only 55 lbs. apiece and measured not much larger than a birthday cake, the three ST5 "micro-satellites" fit onboard a single Pegasus rocket. Above Earths atmosphere, the three were flung like Frisbees from the rockets body into the magnetosphere by a revolutionary micro-satellite launcher.
Space Technology 5 is a mission of NASAs New Millennium Program, which tests innovative technologies for use on future space missions. The 90-day flight of ST5 validated several devices crucial to space buoys: miniature magnetometers, high-efficiency solar arrays, and some strange-looking but effective micro-antennas designed from principles of Darwinian evolution. Also, ST5 showed that three satellites could maneuver together as a "constellation," spreading out to measure complex fields and currents.
"ST5 was able to measure the motion and thickness of current sheets in the magnetosphere," says Le, the missions project scientist at Goddard. "This could not have been done with a single spacecraft, no matter how capable."
The ST5 mission is finished but the technology it tested will key future studies of the magnetosphere. Thanks to ST5, hopes Le, lonely buoys will soon be a thing of the past.
Learn more about ST5s miniaturized technologies at nmp.nasa.gov/st5. Kids (and grownups) can get a better understanding of the artificial evolutionary process used to design ST5s antennas at http://spaceplace.nasa.gov/en/kids/st5/emoticon
This article was provided by the Jet Propulsion Laboratory, California Institute of Technology, under a contract with the National Aeronautics and Space Administration.
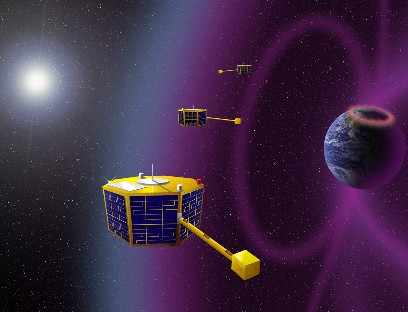
Caption: The Space Technology 5 micro-satellites proved the feasibility of using a constellation of small spacecraft with miniature magnetometers to study Earths magnetosphere.
Ozone, the Greenhouse Gas
We all know that ozone in the stratosphere blocks harmful ultraviolet sunlight, and perhaps some people know that ozone at the Earth's surface is itself harmful, damaging people's lungs and contributing to smog.
But did you know that ozone also acts as a potent greenhouse gas? At middle altitudes between the ground and the stratosphere, ozone captures heat much as carbon dioxide does.
In fact, pound for pound, ozone is about 3000 times stronger as a greenhouse gas than CO2. So even though there's much less ozone at middle altitudes than CO2, it still packs a considerable punch. Ozone traps up to one-third as much heat as the better known culprit in climate change.
Scientists now have an unprecedented view of this mid-altitude ozone thanks to an instrument aboard NASA's Aura satellite called the Tropospheric Emission Spectrometer - "TES" for short.
Most satellites can measure only the total amount of ozone in a vertical column of air. They can't distinguish between helpful ozone in the stratosphere, harmful ozone at the ground, and heat-trapping ozone in between. By looking sideways toward Earths horizon, a few satellites have managed to probe the vertical distribution of ozone, but only to the bottom of the stratosphere.
Unlike the others, TES can measure the distribution of ozone all the way down to the heat-trapping middle altitudes. "We see vertical information in ozone that nobody else has measured before from space," says Annmarie Eldering, Deputy Principal Investigator for TES.
The global perspective offered by an orbiting satellite is especially important for ozone. Ozone is highly reactive. It is constantly being created and destroyed by photochemical reactions in the atmosphere and by lightning. So its concentration varies from region to region, from season to season, and as the wind blows.
Data from TES show that ozone's heat-trapping effect is greatest in the spring, when intensifying sunlight and warming temperatures fuel the reactions that generate ozone. Most of ozone's contribution to the greenhouse effect occurs within 45 degrees latitude from the equator.
Increasing industrialization, particularly in the developing world, could lead to an increase in mid-altitude ozone, Eldering says. Cars and coal-fired power plants release air pollutants that later react to produce more ozone.
"There's concern that overall background levels are slowly increasing over time," Eldering says. TES will continue to monitor these trends, she says, keeping a careful eye on ozone, the greenhouse gas.
Learn more about TES and the science of ozone at http://tes.jpl.nasa.gov/
Kids can get a great introduction to good ozone and bad ozone at http://spaceplace.nasa.gov/en/kids/tes/gases
This article was provided by the Jet Propulsion Laboratory, California Institute of Technology, under a contract with the National Aeronautics and Space Administration.
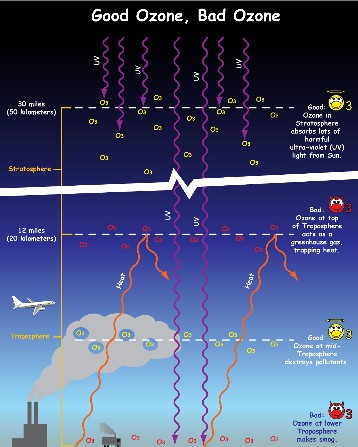
Caption: Ozone behaves differently at different altitudes in the atmosphere. High in the stratosphere and at mid-troposphere it has positive effects on life at the surface. At the top of the troposphere ozone is a greenhouse gas and at the surface it makes smog.
Stellar Compass for Space Explorers
by Patrick Barry
In space, there's no up or down, north or south, east or west. So how can robotic spacecraft know which way they're facing when they fire their thrusters, or when they try to beam scientific data back to Earth?
Without the familiar compass points of Earth's magnetic poles, spacecraft use stars and gyros to know their orientation. Thanks to a recently completed test flight, future spacecraft will be able to do so using only an ultra-low-power camera and three silicon wafers as small as your pinky fingernail.
"The wafers are actually very tiny gyros," explains Artur Chmielewski, project manager at JPL for Space Technology 6 (ST6), a part of NASA's New Millennium Program.
Traditional gyros use spinning wheels to detect changes in pitch, yaw, and roll - the three axes of rotation. For ST6's Inertial Stellar Compass, the three gyros instead consist of silicon wafers that resemble microchips. Rotating the wafers distorts microscopic structures on the surfaces of these wafers in a way that generates electric signals. The compass uses these signals - along with images of star positions taken by the camera - to measure rotation.
Because the Inertial Stellar Compass (ISC) is based on this new, radically different technology, NASA needed to flight-test it before using it in important missions. That test flight reached completion in December 2007 after about a year in orbit aboard the Air Force's TacSat-2 satellite.
"It just performed beautifully," Chmielewski says. "The data checked out really well." The engineers had hoped that ISC would measure the spacecraft's rotation with an accuracy of 0.1 degrees. In the flight tests, ISC surpassed this goal, measuring rotation to within about 0.05 degrees.
That success paves the way for using ISC to reduce the cost of future science missions. When launching probes into space, weight equals money. "If you're paying a million dollars per kilogram to send your spacecraft to Mars, you care a lot about weight," Chmielewski says. At less than 3 kilograms, ISC weighs about one-fifth as much as traditional stellar compasses. It also uses about one-tenth as much power, so a spacecraft would be able to use smaller, lighter solar panels.
Engineers at Draper Laboratory, the Cambridge, Massachusetts, company that built the ISC, are already at work on a next-generation design that will improve the compass's accuracy ten-fold, Chmielewski says. So ISC and its successors could soon help costs - and spacecraft - stay on target.
Find out more about the ISC at http://nmp.nasa.gov/st6/
Kids can do a fun project and get an introduction to navigating by the stars at http://spaceplace.nasa.gov/en/kids/st6starfinder/st6starfinder.shtmlThis article was provided by the Jet Propulsion Laboratory, California Institute of Technology, under a contract with the National Aeronautics and Space Administration.
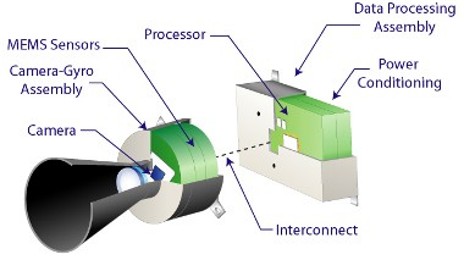
Caption: Compass is built as two separate assemblies, the camera-gyro assembly and the data processor assembly, connected by a wiring harness. The technology uses an active pixel sensor in a wide-field-of-view miniature star camera and micro-electromechanical system (MEMS) gyros. Together, they provide extremely accurate information for navigation and control.
Tracking Wildlife from Space
by Patrick Barry
It's 10 o'clock, and do you know where your Oriental Honey Buzzard is?
Tracking the whereabouts of birds and other migrating wildlife across thousands of miles of land, air, and sea is no easy feat. Yet to protect the habitats of endangered species, scientists need to know where these roving animals go during their seasonal travels.
Rather than chasing these animals around the globe, a growing number of scientists are leveraging the bird's-eye view of orbiting satellites to easily monitor animals' movements anywhere in the world.
The system piggybacks on weather satellites called Polar Operational Environmental Satellites, which are operated by the National Oceanic and Atmospheric Administration (NOAA), as well as a European satellite called MetOp. Sensors aboard these satellites pick up signals beamed from portable transmitters on the Earth's surface, 850 kilometers below. NOAA began the project - called Argos - in cooperation with NASA and the French space agency (CNES) in 1974. At that time, scientists placed these transmitters primarily on buoys and balloons to study the oceans and atmosphere. As electronics shrank and new satellites' sensors became more sensitive, the transmitters became small and light enough by the 1990s that scientists could mount them safely on animals. Yes, even on birds like the Oriental Honey Buzzard.
"Scientists just never had the capability of doing this before," says Christopher O'Connors, Program Manager for Argos at NOAA.
Today, transmitters weigh as little as 1/20th of a pound and require a fraction of a watt of power. The satellites can detect these feeble signals in part because the transmitters broadcast at frequencies between 401 and 403 MHz, a part of the spectrum reserved for environmental uses. That way there's very little interference from other sources of radio noise.
"Argos is being used more and more for animal tracking," OConnors says. More than 17,000 transmitters are currently being tracked by Argos, and almost 4,000 of them are on wildlife. "The animal research has been the most interesting area in terms of innovative science."
For example, researchers in Japan used Argos to track endangered Grey-faced Buzzards and Oriental Honey Buzzards for thousands of kilometers along the birds' migrations through Japan and Southeast Asia. Scientists have also mapped the movements of loggerhead sea turtles off the west coast of Africa. Other studies have documented migrations of wood storks, Malaysian elephants, porcupine caribou, right whales, and walruses, to name a few.
Argos data is available online at www.argos-system.org, so every evening, scientists can check the whereabouts of all their herds, schools, and flocks. Kids can learn about some of these endangered species and play a memory game with them at http://spaceplace.jpl.nasa.gov/en/kids/poes_tracking/
This article was provided by the Jet Propulsion Laboratory, California Institute of Technology, under a contract with the National Aeronautics and Space Administration.
![]()
Caption: The ARGOS program tracks the whereabouts of endangered migrating animals via miniature transmitters on the animals and the POES satellites in orbit.
Invisible Spiral Arms
by Patrick Barry
At one time or another, we've all stared at beautiful images of spiral galaxies, daydreaming about the billions of stars and countless worlds they contain. What mysteries - and even life forms - must lurk within those vast disks?
Now consider this: many of the galaxies you've seen are actually much larger than they appear. NASA's Galaxy Evolution Explorer, a space telescope that "sees" invisible, ultraviolet light, has revealed that roughly 20 percent of nearby galaxies have spiral arms that extend far beyond the galaxies' apparent edges. Some of these galaxies are more than three times larger than they appear in images taken by ordinary visible-light telescopes.
"Astronomers have been observing some of these galaxies for many, many years, and all that time, there was a whole side to these galaxies that they simply couldn't see," says Patrick Morrissey, an astronomer at Caltech in Pasadena, California, who collaborates at JPL.
The extended arms of these galaxies are too dim in visible light for most telescopes to detect, but they emit a greater amount of UV light. Also, the cosmic background is much darker at UV wavelengths than it is for visible light. "Because the sky is essentially black in the UV, far-UV enables you to see these very faint arms around the outsides of galaxies," Morrissey explains.
These "invisible arms" are made of mostly young stars shining brightly at UV wavelengths. Why UV? Because the stars are so hot. Young stars burn their nuclear fuel with impetuous speed, making them hotter and bluer than older, cooler stars such as the sun. (Think of a candle: blue flames are hotter than red ones.) Ultraviolet is a sort of "ultra-blue" that reveals the youngest, hottest stars of all.
"That's the basic idea behind the Galaxy Evolution Explorer in the first place. By observing the UV glow of young stars, we can see where star formation is active," Morrissey says.
The discovery of these extended arms provides fresh clues for scientists about how some galaxies form and evolve, a hot question right now in astronomy. For example, a burst of star formation so far from the galaxies' denser centers may have started because of the gravity of neighboring galaxies that passed too close. But in many cases, the neighboring galaxies have not themselves sprouted extended arms, an observation that remains to be explained. The Galaxy Evolution Explorer reveals one mystery after another!
"How much else is out there that we don't know about?" Morrissey asks. "It makes you wonder."
Spread the wonder by seeing for yourself some of these UV images at www.galex.caltech.edu. Also, Chris Martin, principle scientist for Galaxy Evolution Explorer - or rather his cartoon alter-ego - gives kids a great introduction to ultraviolet astronomy at http://spaceplace.nasa.gov/en/kids/live#martin
This article was provided by the Jet Propulsion Laboratory, California Institute of Technology, under a contract with the National Aeronautics and Space Administration.
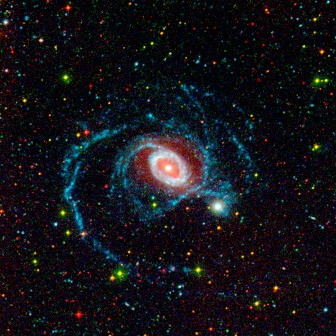
Caption (color image): In this image of galaxy NGC 1512, red represents its visible light appearance, the glow coming from older stars, while the bluish-white ring and the long, blue spiral arms show the galaxy as the Galaxy Evolution Explorer sees it in ultraviolet, tracing primarily younger stars. (Credit: NASA/JPL-Caltech/DSS/GALEX).
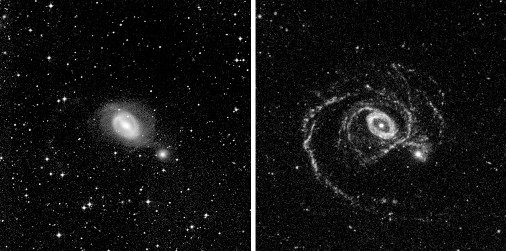
Caption (greyscale images): Galaxy NGC 1512 is represented in both images. The visible light image on the left shows the glow of older stars, while the Galaxy Evolution Explorer ultraviolet image on the right shows the ring and long, spiral arms, tracing primarily younger stars. (Credit: NASA/JPL-Caltech/DSS/GALEX).
No Mars Rock Unturned
Imagine someday taking a driving tour of the surface of Mars. You trail-blaze across a dusty valley floor, looking in amazement at the rocky, orange-brown hillsides and mountains all around. With each passing meter, you spy bizarre-looking rocks that no human has ever seen, and may never see again. Are they meteorites or bits of Martian crust? They beg to be photographed.
But on this tour, you can't whip out your camera and take on-the-spot close-ups of an especially interesting-looking rock. You have to wait for orders from headquarters back on Earth, and those orders won't arrive until tomorrow. By then, you probably will have passed the rock by. How frustrating!
That's essentially the predicament of the Spirit and Opportunity rovers, which are currently in their fourth year of exploring Mars. Mission scientists must wait overnight for the day's data to download from the rovers, and the rovers can't take high-res pictures of interesting rocks without explicit instructions to do so.
However, artificial intelligence software developed at JPL could soon turn the rovers into more-autonomous shutterbugs.
This software, called Autonomous Exploration for Gathering Increased Science (AEGIS), would search for interesting or unusual rocks using the rovers' low-resolution, black-and-white navigational cameras. Then, without waiting for instructions from Earth, AEGIS could direct the rovers' high-resolution cameras, spectrometers, and thermal imagers to gather data about the rocks of interest.
"Using AEGIS, the rovers could get science data that they would otherwise miss," says Rebecca Castaño, leader of the AEGIS project at JPL. The software builds on artificial intelligence technologies pioneered by NASA's Earth Observing-1 satellite (EO-1), one of a series of technology-testbed satellites developed by NASA's New Millennium Program.
AEGIS identifies a rock as being interesting in one of two ways. Mission scientists can program AEGIS to look for rocks with certain traits, such as smoothness or roughness, bright or dark surfaces, or shapes that are rounded or flat.
In addition, AEGIS can single out rocks simply because they look unusual, which often means the rocks could tell scientists something new about Mars's present and past.
The software has been thoroughly tested, Castaño says, and now it must be integrated and tested with other flight software, then uploaded to the rovers on Mars. Once installed, she hopes, Spirit and Opportunity will leave no good Mars rock unturned.
Check out other ways that the Mars Rovers have been upgraded with artificial intelligence software at http://nmp.nasa.gov/TECHNOLOGY/infusion.html#sciencecraft
This article was provided by the Jet Propulsion Laboratory, California Institute of Technology, under a contract with the National Aeronautics and Space Administration.
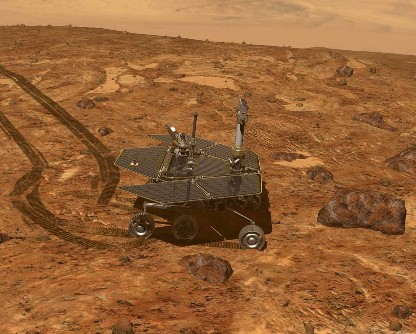
Caption: Are these rocks of any scientific interest? With the new AEGIS software, the Mars Rovers, Spirit and Opportunity, will be able to judge for themselves whether a scene is worth a high-resolution image. (Artists rendering).