How Will We Finally Image the Event Horizon of a Black Hole?
By Ethan Siegel
One hundred years ago, Albert Einstein first put forth his theory of General Relativity, which laid out the relationship between spacetime and the matter and energy present within it. While it successfully recovered Newtonian gravity and predicted the additional precession of Mercury's orbit, the only exact solution that Einstein himself discovered was the trivial one: that for completely empty space. Less than two months after releasing his theory, however, the German scientist Karl Schwarzschild provided a true exact solution, that of a massive, infinitely dense object, a black hole.
One of the curious things that popped out of Schwarzschild's solution was the existence of an event horizon, or a region of space that was so severely curved that nothing, not even light, could escape from it. The size of this event horizon would be directly proportional to the mass of the black hole. A black hole the mass of Earth would have an event horizon less than a centimeter in radius; a black hole the mass of the sun would have an event horizon just a few kilometers in radius; and a supermassive black hole would have an event horizon the size of a planetary orbit.
Our galaxy has since been discovered to house a black hole about four million solar masses in size, with an event horizon about 23.6 million kilometers across, or about 40 percent the size of Mercury's orbit around the sun. At a distance of 26,000 light years, it's the largest event horizon in angular size visible from Earth, but at just 19 micro-arc-seconds, it would take a telescope the size of Earth to resolve it a practical impossibility.
But all hope isn't lost! If instead of a single telescope, we built an array of telescopes located all over Earth, we could simultaneously image the galactic center, and use the technique of VLBI (very long-baseline interferometry) to resolve the black hole's event horizon. The array would only have the light-gathering power of the individual telescopes, meaning the black hole (in the radio) will appear very faint, but they can obtain the resolution of a telescope that's the distance between the farthest telescopes in the array! The planned Event Horizon Telescope, spanning four different continents (including Antarctica), should be able to resolve under 10 micro-arc-seconds, imaging a black hole directly for the first time and answering the question of whether or not they truly contain an event horizon. What began as a mere mathematical solution is now just a few years away from being observed and known for certain!
Note: This months article describes a project that is not related to NASA and does not suggest any relationship or endorsement. Its coverage is for general interest and educational purposes.
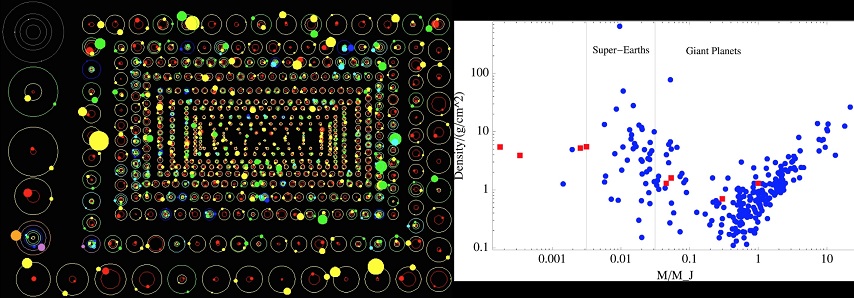
Image credit: NASA/CXC/Amherst College/D.Haggard et al., of the galactic center in X-rays. Sagittarius A* is the supermassive black hole at our Milky Way's center, which normally emits X-ray light of a particular brightness. However, 2013 saw a flare increase its luminosity by a factor of many hundreds, as the black hole devoured matter. The event horizon has yet to be revealed.
This article was provided by the Jet Propulsion Laboratory, California Institute of Technology, under a contract with the National Aeronautics and Space Administration.
Our Solar System Is Almost Normal, But Not Quite
By Ethan Siegel
It was just over 20 years ago that the very first exoplanet was found and confirmed to be orbiting a star not so different from our own sun. Fast forward to the present day, and the stellar wobble method, wherein the gravitational tug of a planet perturbs a star's motion, has been surpassed in success by the transit method, wherein a planet transits across the disk of its parent star, blocking a portion of its light in a periodic fashion. Thanks to these methods and NASA's Kepler spacecraft, we've identified many thousands of candidate planets, with nearly 2,000 of them having been confirmed, and their masses and densities measured.
The gas giants found in our solar system actually turn out to be remarkably typical: Jupiter-mass planets are very common, with less-massive and more-massive giants both extremely common. Saturnthe least dense world in our solar systemis actually of a fairly typical density for a gas giant world. It turns out that there are many planets out there with Saturns density or less. The rocky worlds are a little harder to quantify, because our methods and missions are much better at finding higher-mass planets than low-mass ones. Nevertheless, the lowest mass planets found are comparable to Earth and Venus, and range from just as dense to slightly less dense. We also find that we fall right into the middle of the "bell curve" for how old planetary systems are: we're definitely typical in that regard.
But there are a few big surprises, which is to say there are three major ways our solar system is an outlier among the planets we've observed:
· All our solar system's planets are significantly farther out than the average distance for exoplanets around their stars. More than half of the planets we've discovered are closer to their star than Mercury is to ours, which might be a selection effect (closer planets are easier to find), but it might indicate a way our star is unusual: being devoid of very close-in planets.
· All eight of our solar system's planets orbits are highly circular, with even the eccentric Mars and Mercury only having a few percent deviation from a perfect circle. But most exoplanets have significant eccentricities, which could indicate something unusual about us.
· And finally, one of the most common classes of exoplaneta super-Earth or mini-Neptune, with 1.5-to-10 times the mass of Earthis completely missing from our solar system.
Until we develop the technology to probe for lower-mass planets at even greater distances around other star systems, we won't truly know for certain how unusual we really are!
Images credit:
Images credit: NASA / Kepler Dan Fabricky (L), of a selection of the known Kepler exoplanets; Rebecca G. Martin and Mario Livio (2015) ApJ 810, 105 (R), of 287 confirmed exoplanets relative to our eight solar system planets.
This article was provided by the Jet Propulsion Laboratory, California Institute of Technology, under a contract with the National Aeronautics and Space Administration.
How We Know Mars Has Liquid Water On Its Surface
By Ethan Siegel
Of all the planets in the solar system other than our own, Mars is the one place with the most Earth-like past. Geological features on the surface such as dried up riverbeds, sedimentary patterns, mineral spherules nicknamed "blueberries," and evidence of liquid-based erosion all tell the same story: that of a wet, watery past. But although we've found plenty of evidence for molecular water on Mars in the solid (ice) and gaseous (vapor) states, including in icecaps, clouds and subsurface ices exposed (and sublimated) by digging, that in no way meant there'd be water in its liquid phase today.
Sure, water flowed on the surface of Mars during the first billion years of the solar system, perhaps producing an ocean a mile deep, though the ocean presence is still much debated. Given that life on Earth took hold well within that time, its conceivable that Mars was once a rich, living planet as well. But unlike Earth, Mars is small: small enough that its interior cooled and lost its protective magnetic field, enabling the sun's solar wind to strip its atmosphere away. Without a significant atmosphere, the liquid phase of water became a virtual impossibility, and Mars became the arid world we know it to be today.
But certain ionspotassium, calcium, sodium, magnesium, chloride and fluoride, among othersget left behind when the liquid water disappears, leaving a salt residue of mineral salts (that may include table salt, sodium chloride) on the surface. While pure liquid water may not persist at standard Martian pressures and temperatures, extremely salty, briny water can indeed stay in a liquid state for extended periods under the conditions on the Red Planet. It's more of a "sandy crust" like you'd experience on the shore when the tide goes out than the flowing waters we're used to in rivers on Earth, but it means that under the right temperature conditions, liquid water does exist on Mars today, at least in small amounts.
The measured presence and concentration of these salts, found in the dark streaks that come and go on steep crater walls, combined with our knowledge of how water behaves under certain physical and chemical conditions and the observations of changing features on the Martian surface supports the idea that this is the action of liquid water. Short of taking a sample and analyzing it in situ on Mars, this is the best current evidence we have for liquid water on our red neighbor. Next up? Finding out if there are any single-celled organisms hardy enough to survive and thrive under those conditions, possibly even native to Mars itself!
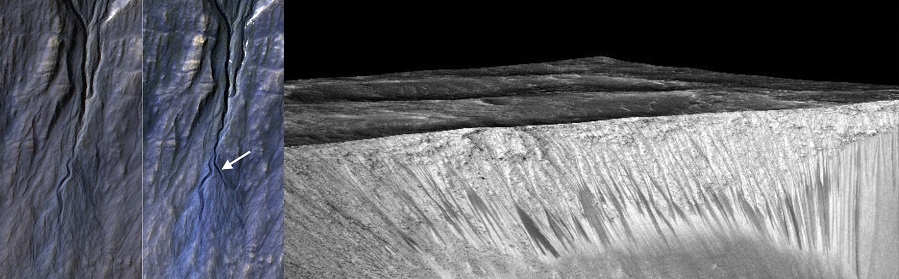
Images credit: NASA/JPL-Caltech/Univ. of Arizona, of a newly-formed gully on the Martian surface (L) and of the series of gullies where the salt deposits were found (R).
This article was provided by the Jet Propulsion Laboratory, California Institute of Technology, under a contract with the National Aeronautics and Space Administration.
Measure the Moon's Size and Distance During the Next Lunar Eclipse
By Dr. Ethan Siegel
The moon represents perhaps the first great paradox of the night sky in all of human history. While its angular size is easy to measure with the unaided eye from any location on Earth, ranging from 29.38 arc-minutes (0.4897°) to 33.53 arc-minutes (0.5588°) as it orbits our world in an ellipse, that doesn't tell us its physical size. From its angular size alone, the moon could just as easily be close and small as it could be distant and enormous.
But we know a few other things, even relying only on naked-eye observations. We know its phases are caused by its geometric configuration with the sun and Earth. We know that the sun must be farther away (and hence, larger) than the moon from the phenomenon of solar eclipses, where the moon passes in front of the sun, blocking its disk as seen from Earth. And we know it undergoes lunar eclipses, where the sun's light is blocked from the moon by Earth.
Lunar eclipses provided the first evidence that Earth was round; the shape of the portion of the shadow that falls on the moon during its partial phase is an arc of a circle. In fact, once we measured the radius of Earth (first accomplished in the 3rd century B.C.E.), now known to be 6,371 km, all it takes is one assumptionthat the physical size of Earth's shadow as it falls on the moon is approximately the physical size of Earthand we can use lunar eclipses to measure both the size of and the distance to the moon!
Simply by knowing Earth's physical size and measuring the ratios of the angular size of its shadow and the angular size of the moon, we can determine the moon's physical size relative to Earth. During a lunar eclipse, Earth's shadow is about 3.5 times larger than the moon, with some slight variations dependent on the moon's point in its orbit. Simply divide Earth's radius by your measurement to figure out the moon's radius!
Even with this primitive method, it's straightforward to get a measurement for the moon's radius that's accurate to within 15% of the actual value: 1,738 km. Now that you've determined its physical size and its angular size, geometry alone enables you to determine how far away it is from Earth. A lunar eclipse is coming up on September 28th, and this supermoon eclipse will last for hours. Use the partial phases to measure the size of and distance to the moon, and see how close you can get!
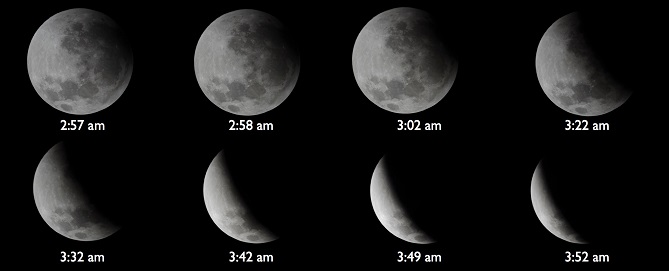
Image credit: Daniel Munizaga (NOAO South/CTIO EPO), using the Cerro Tololo Inter-American Observatory, of an eight-image sequence of the partial phase of a total lunar eclipse.
This article was provided by the Jet Propulsion Laboratory, California Institute of Technology, under a contract with the National Aeronautics and Space Administration.
Solar Wind Createsand Whipsa Magnetic Tail Around Earth
By Dr. Ethan Siegel
As Earth spins on its axis, our planet's interior spins as well. Deep inside our world, Earth's metal-rich core produces a magnetic field that spans the entire globe, with the magnetic poles offset only slightly from our rotational axis. If you fly up to great distances, well above Earth's surface, you'll find that this magnetic web, called the magnetosphere, is no longer spherical. It not only bends away from the direction of the sun at high altitudes, but it exhibits some very strange features, all thanks to the effects of our parent star.
The sun isn't just the primary source of light and heat for our world; it also emits an intense stream of charged particles, the solar wind, and has its own intense magnetic field that extends much farther into space than our own planet's does. The solar wind travels fast, making the 150 million km (93 million mile) journey to our world in around three days, and is greatly affected by Earth. Under normal circumstances, our world's magnetic field acts like a shield for these particles, bending them out of the way of our planet and protecting plant and animal life from this harmful radiation.
But for every action, there's an equal and opposite reaction: as our magnetosphere bends the solar wind's ions, these particles also distort our magnetosphere, creating a long magnetotail that not only flattens and narrows, but whips back-and-forth in the onrushing solar wind. The particles are so diffuse that collisions between them practically never occur, but the electromagnetic interactions create waves in Earth's magnetosphere, which grow in magnitude and then transfer energy to other particles. The charged particles travel within the magnetic field toward both poles, and when they hit the ionosphere region of Earths upper atmosphere, they collide with ions of oxygen and nitrogen causing aurora. Missions such as the European Space Agency and NASA Cluster mission have just led to the first accurate model and understanding of equatorial magnetosonic waves, one such example of the interactions that cause Earth's magnetotail to whip around in the wind like so.
The shape of Earth's magnetic field not only affects aurorae, but can also impact satellite electronics. Understanding its shape and how the magnetosphere interacts with the solar wind can also lead to more accurate predictions of energetic electrons in near-Earth space that can disrupt our technological infrastructure. As our knowledge increases, we may someday be able to reach one of the holy grails of connecting heliophysics to Earth: forecasting and accurately predicting space weather and its effects. Thanks to the Cluster Inner Magnetosphere Campaign, Van Allen Probes, Mars Odyssey Thermal Emission Imaging System, Magnetospheric Multiscale, and Heliophysics System Observatory missions, we're closer to this than ever before.
Kids can learn about how solar wind defines the edges of our solar system at NASA Space Place. http://spaceplace.nasa.gov/interstellar
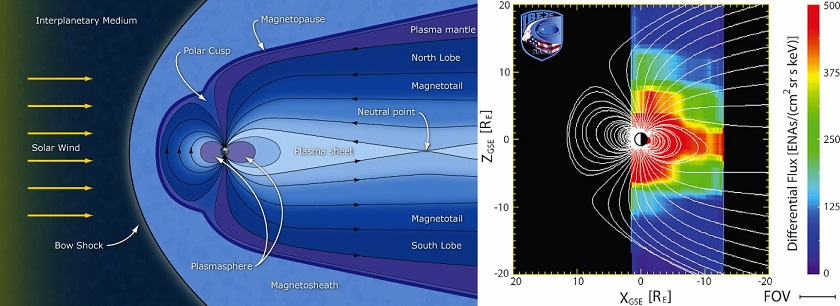
Image credit: ESA / C. T. Russell (L), of Earth's magnetic tail and its cause: the solar wind; Southwest Research Institute / IBEX Science Team (R), of the first image of the plasma sheet and plasmasphere created around Earth by the solar wind.
This article was provided by the Jet Propulsion Laboratory, California Institute of Technology, under a contract with the National Aeronautics and Space Administration.
On The Brightness Of Venus
By Dr. Ethan Siegel
Throughout the past few months, Venus and Jupiter have been consistently the brightest two objects visible in the night sky (besides the moon) appearing in the west shortly after sunset. Jupiter is the largest and most massive planet in the solar system, yet Venus is the planet that comes closest to our world. On June 30th, Venus and Jupiter made their closest approach to one another as seen from Eartha conjunctioncoming within just 0.4° of one another, making this the closest conjunction of these two worlds in over 2,000 years.
And yet throughout all this time, and especially notable near its closest approach, Venus far outshines Jupiter by 2.7 astronomical magnitudes, or a factor of 12 in apparent brightness. You might initially think that Venuss proximity to Earth would explain this, as a cursory check would seem to show. On June 30th Venus was 0.5 astronomical units (AU) away from Earth, while Jupiter was six AU away. This appears to be exactly the factor of 12 that you need.
Only this doesn't explain things at all! Brightness falls off as the inverse square of the distance, meaning that if all things were equal, Venus ought to seem not 12 but 144 times brighter than Jupiter. There are three factors in play that set things back on the right path: size, albedo, and illumination. Jupiter is 11.6 times the diameter of Venus, meaning that despite the great difference in distance, the two worlds spanned almost exactly the same angular diameter in the sky on the date of the conjunction. Moreover, while Venus is covered in thick, sulfuric acid clouds, Jupiter is a reflective, cloudy world, too. All told, Venus possesses only a somewhat greater visual geometric albedo (or amount of reflected visible light) than Jupiter: 67 percent and 52 percent, respectively. Finally, while Venus and Jupiter both reflect sunlight toward Earth, Jupiter is always in the full (or almost full) phase, while Venus (on June 30th) appeared as a thick crescent.
All told, it's a combination of these four factorsdistance, size, albedo, and the phase-determined illuminated areathat determine how bright a planet appears to us, and all four need to be taken into account to explain our observations.
Don't fret if you missed the Venus-Jupiter conjunction; three more big, bright, close ones are coming up later this year in the eastern pre-dawn sky: Mars-Jupiter on October 17, Venus-Jupiter on October 26, and Venus-Mars on November 3.
Keep watching the skies, and enjoy the spectacular dance of the planets!
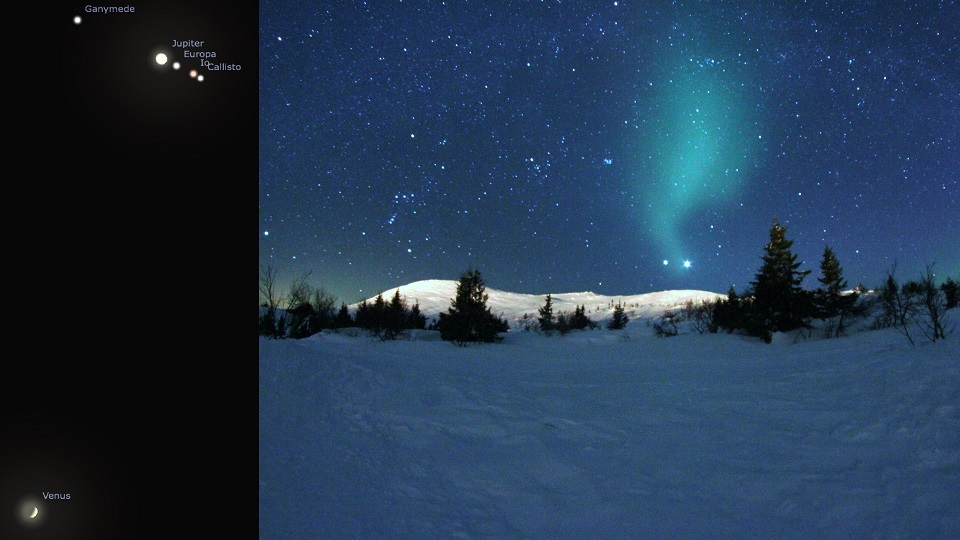
Image credit: E. Siegel, using the free software Stellarium (L); Wikimedia Commons user TimothyBoocock, under a c.c.-share alike 3.0 license (R). The June 30th conjunction (L) saw Venus and Jupiter pass within 0.4° of one another, yet Venus always appears much brighter (R), as it did in this image from an earlier conjunction.
This article was provided by the Jet Propulsion Laboratory, California Institute of Technology, under a contract with the National Aeronautics and Space Administration.
No Surprise! Earths Strongest Gravity Lies Atop The Highest Mountains
By Dr. Ethan Siegel
Put more mass beneath your feet and feel the downward acceleration due to gravity increase. Newton's law of universal gravitation may have been superseded by Einstein's, but it still describes the gravitational force and acceleration here on Earth to remarkable precision. The acceleration you experience is directly proportional to the amount of mass you "see," but inversely proportional to the distance from you to that mass squared.
The denser the mass beneath your feet, the stronger the gravitational force, and when you are closer to such a mass, the force is even greater. At higher elevations or even higher altitudes, you'd expect your gravitational force to drop as you move farther from Earth's center. You'd probably also expect that downward acceleration to be greater if you stood atop a large mountain than if you flew tens of thousands of feet above a flat ocean, with nothing but ultra-light air and liquid water beneath you for all those miles. In fact this is true, but not just due to the mountains extra mass!
Earth is built like a layer-cake, with the less dense atmosphere, ocean, and crust floating atop the denser mantle, which in turn floats atop the outer and inner cores of our planet. An icebergs buoyancy is enough to lift only about one tenth of it above the sea, with the other nine tenths below the surface. Similarly, each and every mountain range has a corresponding "invisible mountain" that dips deep into the mantle. Beneath the ocean floor, Earth's crust might be only three to six miles thick, but it can exceed 40 miles in thickness around major mountain ranges like the Himalayas and the Andes. Its where one of Earths tectonic plates subducts beneath another that we see the largest gravitational anomalies: another confirmation of the theory of continental drift.
A combination of instruments aboard NASA's Gravity Recovery and Climate Experiment (GRACE) satellites, including the SuperSTAR accelerometer, the K-band ranging system and the onboard GPS receiver, have enabled the construction of the most accurate map of Earth's gravitational field ever: to accelerations of nanometers per second squared. While the mountaintops may be farther from Earth's center than any other point, the extra mass of the mountains and their roots minus the mass of the displaced mantle accounts for the true gravitational accelerations we actually see. It's only by the grace of these satellites that we can measure this to such accuracy and confirm what was first conjectured in the 1800s: that the full layer-cake structure of Earth must be accounted for to explain the gravity we experience on our world!
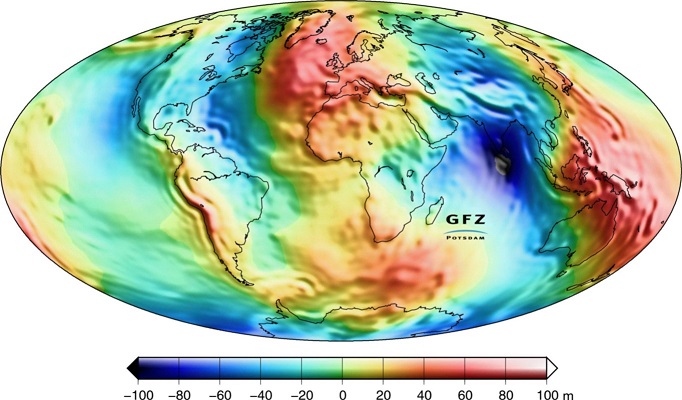
Image credit: NASA / GRACE mission / Christoph Reigber, et al. (2005): An Earth gravity field model complete to degree and order 150 from GRACE: EIGEN-GRACE02S, Journal of Geodynamics 39(1),110. Reds indicate greater gravitational anomalies; blues are smaller ones.
This article was provided by the Jet Propulsion Laboratory, California Institute of Technology, under a contract with the National Aeronautics and Space Administration.
The "G" in GOES Is What Makes It Go
By Dr. Ethan Siegel
Going up into space is the best way to view the universe, eliminating all the distortionary effects of weather, clouds, temperature variations and the atmosphere's airflow all in one swoop. It's also the best way, so long as you're up at high enough altitudes, to view an entire 50 percent of Earth all at once. And if you place your observatory at just the right location, you can observe the same hemisphere of Earth continuously, tracking the changes and behavior of our atmosphere for many years.
The trick, believe it or not, was worked out by Kepler some 400 years ago! The same scientist who discovered that planets orbit the sun in ellipses also figured out the relationship between how distant an object needs to be from a much more massive one in order to have a certain orbital period. All you need to know is the period and distance of one satellite for any given body, and you can figure out the necessary distance to have any desired period. Luckily for us, planet Earth has a natural satellite - the moon - and just from that information, we can figure out how distant an artificial satellite would need to be to have an orbital period that exactly matches the length of a day and the rotational speed of Earth. For our world, that means an orbital distance of 42,164 km (26,199 miles) from Earth's center, or 35,786 km (22,236 miles) above mean sea level.
We call that orbit geosynchronous or geostationary, meaning that a satellite at that distance always remains above the exact same location on our world. Other effectslike solar wind, radiation pressure and the moonrequire onboard thrusters to maintain the satellite's precisely desired position above any given point on Earth's surface. While geostationary satellites have been in use since 1963, it was only in 1974 that the Synchronous Meteorological Satellite (SMS) program began to monitor Earth's weather with them, growing into the Geostationary Operational Environmental Satellite (GOES) program the next year. For 40 years now, GOES satellites have monitored the Earth's weather continuously, with a total of 16 satellites having been launched as part of the program. To the delight of NASA (and Ghostbusters) fans everywhere, GOES-R series will launch in 2016, with thrice the spectral information, four times the spatial resolution and five times the coverage speed of its predecessors, with many other improved capabilities. Yet it's the simplicity of gravity and the geostationary "G" in GOES that gives us the power to observe our hemisphere all at once, continuously, and for as long as we like!
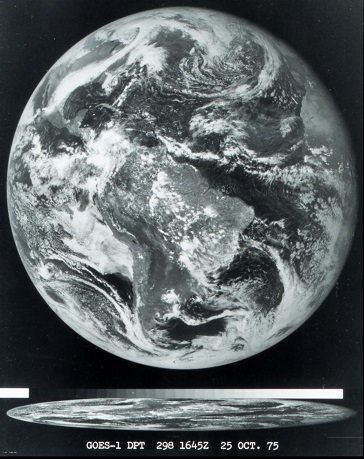
Image credit: National Oceanic and Atmospheric Administration, of the first image ever obtained from a GOES satellite. This image was taken from over 22,000 miles (35,000 km) above the Earth's surface on October 25, 1975.
This article was provided by the Jet Propulsion Laboratory, California Institute of Technology, under a contract with the National Aeronautics and Space Administration.
Is the Most Massive Star Still Alive?
By Dr. Ethan Siegel
The brilliant specks of light twinkling in the night sky, with more and more visible under darker skies and with larger telescope apertures, each have their own story to tell. In general, a star's color correlates very well with its mass and its total lifetime, with the bluest stars representing the hottest, most massive and shortest-lived stars in the universe. Even though they contain the most fuel overall, their cores achieve incredibly high temperatures, meaning they burn through their fuel the fastest, in only a few million years instead of roughly ten billion like our sun.
Because of this, it's only the youngest of all star clusters that contain the hottest, bluest stars, and so if we want to find the most massive stars in the universe, we have to look to the largest regions of space that are actively forming them right now. In our local group of galaxies, that region doesn't belong to the giants, the Milky Way or Andromeda, but to the Large Magellanic Cloud (LMC), a small, satellite galaxy (and fourth-largest in the local group) located 170,000 light years distant.
Despite containing only one percent of the mass of our galaxy, the LMC contains the Tarantula Nebula (30 Doradus), a star-forming nebula approximately 1,000 light years in size, or roughly seven percent of the galaxy itself. You'll have to be south of the Tropic of Cancer to observe it, but if you can locate it, its center contains the super star cluster NGC 2070, holding more than 500,000 unique stars, including many hundreds of spectacular, bright blue ones. With a maximum age of two million years, the stars in this cluster are some of the youngest and most massive ever found.
At the center of NGC 2070 is a very compact concentration of stars known as R136, which is responsible for most of the light illuminating the entire Tarantula Nebula. Consisting of no less than 72 O-class and Wolf-Rayet stars within just 20 arc seconds of one another, the most massive is R136a1, with 260 times the sun's mass and a luminosity that outshines us by a factor of seven million. Since the light has to travel 170,000 light years to reach us, it's quite possible that this star has already died in a spectacular supernova, and might not even exist any longer! The next time you get a good glimpse of the southern skies, look for the most massive star in the universe, and ponder that it might not even still be alive.

Images credit: ESO/IDA/Danish 1.5 m/R. Gendler, C. C. Thöne, C. Féron, and J.-E. Ovaldsen (L), of the giant star-forming Tarantula Nebula in the Large Magellanic Cloud; NASA, ESA, and E. Sabbi (ESA/STScI), with acknowledgment to R. O'Connell (University of Virginia) and the Wide Field Camera 3 Science Oversight Committee (R), of the central merging star cluster NGC 2070, containing the enormous R136a1 at the center.
This article was provided by the Jet Propulsion Laboratory, California Institute of Technology, under a contract with the National Aeronautics and Space Administration.
The Cold Never Bothered Me Anyway
By Dr. Ethan Siegel
For those of us in the northern hemisphere, winter brings long, cold nights, which are often excellent for sky watchers (so long as there's a way to keep warm!) But there's often an added bonus that comes along when conditions are just right: the polar lights, or the Aurora Borealis around the North Pole. Here on our world, a brilliant green light often appears for observers at high northern latitudes, with occasional, dimmer reds and even blues lighting up a clear night.
We had always assumed that there was some connection between particles emitted from the Sun and the aurorae, as particularly intense displays were observed around three days after a solar storm occurred in the direction of Earth. Presumably, particles originating from the Sunionized electrons and atomic nuclei like protons and alpha particlesmake up the vast majority of the solar wind and get funneled by the Earth's magnetic field into a circle around its magnetic poles. They're energetic enough to knock electrons off atoms and molecules at various layers in the upper atmosphereparticles like molecular nitrogen, oxygen and atomic hydrogen. And when the electrons fall back either onto the atoms or to lower energy levels, they emit light of varying but particular wavelengthsoxygen producing the most common green signature, with less common states of oxygen and hydrogen producing red and the occasional blue from nitrogen.
But it wasn't until the 2000s that this picture was directly confirmed! NASA's Imager for Magnetopause-to-Aurora Global Exploration (IMAGE) satellite (which ceased operations in December 2005) was able to find out how the magnetosphere responded to solar wind changes, how the plasmas were energized, transported and (in some cases) lost, and many more properties of our magnetosphere. Planets without significant magnetic fields such as Venus and Mars have much smaller, weaker aurorae than we do, and gas giant planets like Saturn have aurorae that primarily shine in the ultraviolet rather than the visible. Nevertheless, the aurorae are a spectacular sight in the evening, particularly for observers in Alaska, Canada and the Scandinavian countries. But when a solar storm comes our way, keep your eyes towards the north at night; the views will be well worth braving the cold!
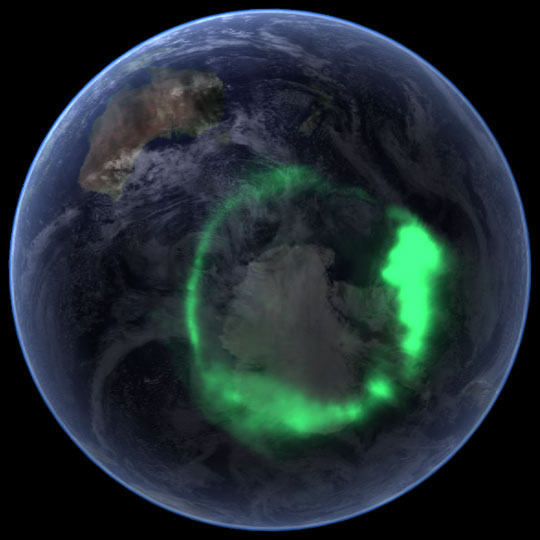
Auroral overlays from the IMAGE spacecraft.
Image credit: NASA Earth Observatory (Goddard Space Flight Center) / Blue Marble team.
The Heavyweight Champion of the Cosmos
By Dr. Ethan Siegel
As crazy as it once seemed, we once assumed that the Earth was the largest thing in all the universe. 2,500 years ago, the Greek philosopher Anaxagoras was ridiculed for suggesting that the Sun might be even larger than the Peloponnesus peninsula, about 16% of modern-day Greece. Today, we know that planets are dwarfed by stars, which themselves are bound together by the billions or even trillions into galaxies.
But gravitationally bound structures extend far beyond galaxies, which themselves can bind together into massive clusters across the cosmos. While dark energy may be driving most galaxy clusters apart from one another, preventing our local group from falling into the Virgo Cluster, for example, on occasion, huge galaxy clusters can merge, forming the largest gravitationally bound structures in the universe.
Take the "El Gordo" galaxy cluster, catalogued as ACT-CL J0102-4915. Its the largest known galaxy cluster in the distant universe. A galaxy like the Milky Way might contain a few hundred billion stars and up to just over a trillion (1012) solar masses worth of matter, the El Gordo cluster has an estimated mass of 3 × 10¹⁵ solar masses, or 3,000 times as much as our own galaxy! The way we've figured this out is fascinating. By seeing how the shapes of background galaxies are distorted into more elliptical-than-average shapes along a particular set of axes, we can reconstruct how much mass is present in the cluster: a phenomenon known as weak gravitational lensing.
That reconstruction is shown in blue, but doesn't match up with where the X-rays are, which are shown in pink! This is because, when galaxy clusters collide, the neutral gas inside heats up to emit X-rays, but the individual galaxies (mostly) and dark matter (completely) pass through one another, resulting in a displacement of the cluster's mass from its center. This has been observed before in objects like the Bullet Cluster, but El Gordo is much younger and farther away. At 10 billion light-years distant, the light reaching us now was emitted more than 7 billion years ago, when the universe was less than half its present age.
It's a good thing, too, because about 6 billion years ago, the universe began accelerating, meaning that El Gordo just might be the largest cosmic heavyweight of all. There's still more universe left to explore, but for right now, this is the heavyweight champion of the distant universe!
Learn more about El Gordo here: http://www.nasa.gov/press/2014/april/nasa-hubble-team-finds-monster-el-gordo-galaxy-cluster-bigger-than-thought/.
El Gordo is certainly huge, but what about really tiny galaxies? Kids can learn about satellite galaxies at NASAs Space Place: http://spaceplace.nasa.gov/satellite-galaxies/.

Image credit: NASA, ESA, J. Jee (UC Davis), J. Hughes (Rutgers U.), F. Menanteau (Rutgers U. and UIUC), C. Sifon (Leiden Observatory), R. Mandelbum (Carnegie Mellon U.), L. Barrientos (Universidad Catolica de Chile), and K. Ng (UC Davis). X-rays are shown in pink from Chandra; the overall matter density is shown in blue, from lensing derived from the Hubble space telescope. 10 billion light-years distant, El Gordo is the most massive galaxy cluster ever found.
This article was provided by the Jet Propulsion Laboratory, California Institute of Technology, under a contract with the National Aeronautics and Space Administration.
Minor Mergers Have Massive Consequences for Black Holes
By Dr. Ethan Siegel
When you think of our sun, the nearest star to our world, you think of an isolated entity, with more than four light years separating it from its next nearest neighbor. But it wasn't always so: billions of years ago, when our sun was first created, it very likely formed in concert with thousands of other stars, when a giant molecular cloud containing perhaps a million times the mass of our solar system collapsed. While the vast majority of stars that the universe formssome ninety-five percentare the mass of our sun or smaller, a rare but significant fraction are ultra-massive, containing tens or even hundreds of times the mass our star contains. When these stars run out of fuel in their cores, they explode in a fantastic Type II supernova, where the star's core collapses. In the most massive cases, this forms a black hole.
Over time, many generations of starsand hence, many black holesform, with the majority eventually migrating towards the centers of their host galaxies and merging together. Our own galaxy, the Milky Way, houses a supermassive black hole that weighs in at about four million solar masses, while our big sister, Andromeda, has one nearly twenty times as massive. But even relatively isolated galaxies didn't simply form from the monolithic collapse of an isolated clump of matter, but by hierarchical mergers of smaller galaxies over tremendous timescales. If galaxies with large amounts of stars all have black holes at their centers, then we should be able to see some fraction of Milky Way-sized galaxies with not just one, but multiple supermassive black holes at their center!
It was only in the early 2000s that NASA's Chandra X-ray Observatory was able to find the first binary supermassive black hole in a galaxy, and that was in an ultra-luminous galaxy with a double core. Many other examples were discovered since, but for a decade they were all in ultra-massive, active galaxies. That all changed in 2011, with the discovery of two active, massive black holes at the center of the regular spiral galaxy NGC 3393, a galaxy that must have undergone only minor mergers no less than a billion years ago, where the black hole pair is separated by only 490 light years! It's only in the cores of active, X-ray emitting galaxies that we can detect binary black holes like this. Examples like NGC 3393 and IC 4970 are not only confirming our picture of galaxy growth and formation, but are teaching us that supermassive relics from ancient, minor mergers might persist as standalone entities for longer than we ever thought!
Check out some cool images and artist reconstructions of black holes from Chandra: http://chandra.harvard.edu/photo/category/blackholes.html.
Kids can learn all about Black Holes from this cool animation at NASAs Space Place: http://spaceplace.nasa.gov/black-holes.
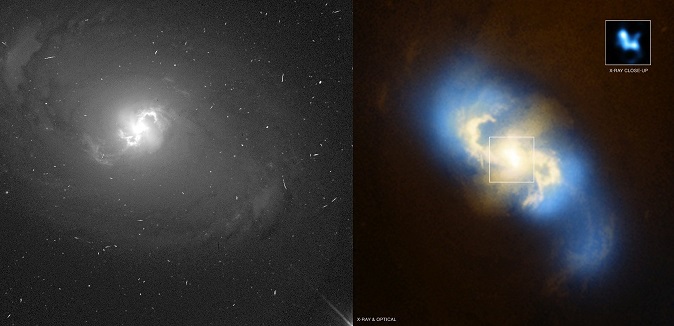
Images credit: NGC 3393 in the optical (L) by M. Malkan (UCLA), HST, NASA (L); NGC 3393 in the X-ray and optical (R), composite by NASA / CXC / SAO / G. Fabbiano et al. (X-ray) and NASA/STScI (optical).
This article was provided by the Jet Propulsion Laboratory, California Institute of Technology, under a contract with the National Aeronautics and Space Administration.